
There are straightforward ways to monitor your risk of metabolic diseases including the number 1 killer, heart disease – and catching the risk factors in time can save lives
Metabolic syndrome is a common but silent condition. It sneaks up on you slowly and develops gradually until it erupts into a medical disaster like a heart attack.
I have met thousands of patients throughout my medical career who had no clue that they were heading for a heart attack. Their serious condition just appeared out of the blue. They were unaware that their “metabolic derangement” occurred due to poor diet and other lifestyle choices.
I have also met many people who are impressed when they see their metabolic risk factors resolve gradually with the implementation of straightforward lifestyle changes. For example, losing 10% of body weight may control blood pressure, settle angina, and improve exercise tolerance.
If we could be guided by a robust screening tool to identify people with metabolic risk early, this would prevent disease and save lives.

This blog explains metabolic risk factors, how to monitor them – at home and with your GP’s help – and the straightforward lifestyle changes you can make to reverse or avoid them. My aim is not to encourage self-diagnosis and self-treatment but to empower people with the knowledge to sit in the driver’s seat and work closely with their doctors to optimise their health and well-being.
High-risk groups
You should find out initially if you are already at high risk. Do you, for instance, have a family history of metabolic disease, which can include being overweight or obese, having high blood pressure, diabetes, heart disease, stroke, dementia, gout or cancer? Do you lead a sedentary life, smoke or drink alcohol to excess?
The answers to these questions can alert you to take immediate action to reduce your risk—perhaps refrain from smoking, reduce your alcohol intake, or increase your physical activity. These will immediately pay dividends to minimise risk and improve your health.
What is metabolic syndrome?
Metabolic syndrome is a group of risk factors that include central obesity (belly fat accommodation), high blood pressure, high blood sugar, and abnormal blood fat characterised by high triglyceride (standard fat) but low HDL (good guy) cholesterol. To diagnose metabolic syndrome, you need three of these five risk factors. We’ll look at each risk factor in turn.
Belly fat
The body fat factor has been refined to mean not general obesity but the accumulation of fat in the abdomen (belly fat or central obesity), which is a metabolic problem.
This is because belly fat sends too much fat to the liver via the portal vein, overwhelming the liver’s capacity to process fat. By comparison, in healthy, obese people, subcutaneous fat storage releases fat into the general circulation, diluting it and reaching the liver in amounts within its processing capacity.
There are many ways to measure body fat, including body weight, BMI, waist size, waist-hip ratio (WHR), waist-height ratio (WhtR) and neck size – plus modern technology, such as bioimpedance and DEXA scan.
Body weight weighs the total body content, including fat, muscle and bone, and is not a good way to assess the body’s fat content.
High BMI indicates a weight problem (excess fat) but does not specify where it is stored. BMI is high in athletes due to high muscle mass and in healthy obese people due to healthy fat storage under the skin. Hence, it is not an accurate predictor of disease.
One study confirmed that BMI is not helpful, as 33% of men and 52% of women with a normal BMI had excess body fat.
BMI ranges: a score of under 18.5 kg/m2 indicates underweight, 18.5 to 24.9 is the normal range, 25 to 29.9 is the overweight range, 30 and above is obesity, and 40 and above is morbid.
Beware of lower cut-offs in the Asian population – <18.5 underweight, 18.5 to 22.9 normal range, 23 to 27.4 overweight, 27.5 and over obesity range.
Waist circumference (WC) measures the amount of fat in your abdomen (belly fat). This includes healthy fat under the skin, which you can feel between your thumb and fingers; visceral fat around abdominal organs, such as the omentum, to protect the intestine and perinephric fat pads around the kidneys; or ectopic fat within your organs, such as the liver (fatty liver). WC is accurate in predicting diabetes, heart disease, and dementia. A groundbreaking study reported that the wider your waistline is, the smaller your brain size.
The waist-hip ratio (WHR) is an even better tool but is often more complex to interpret than WC. For example women usually store fat around the hip area, giving those with higher oestrogen levels a broader hip size. Again, bigger hip muscles in athletes can also result in broader hip size.
Given this complexity, NICE in the UK recommends a waist-height ratio (WHtR). A ratio of 0.4 to 0.49 is a healthy range, 0.5 to 0.59 is at risk, and 0.6 and above is the highest risk. In this case, you should lose weight urgently to lower your risk.
Neck size (NS) could replace waist size to diagnose obesity and being overweight and to identify people at risk of metabolic disease.
Neck circumference is measured below the Adam’s apple, with the person looking forward and with relaxed shoulders. The best cut-offs for identifying patients with central obesity are 32cm (12.6 inches) in females and 38cm (15 inches) in males.
Bio-electric impedance assesses the differences in bodily tissues’ electric resistance. Fat and bone are more resistant to electric passage than the rest of the boy. You can buy a simple device that looks like a weighing scale with or without a handpiece. However, bigger gyms and health club devices are more accurate in analysing your body composition.
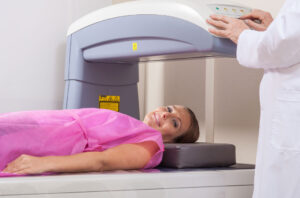
DEXA scan is the gold standard for measuring body composition, including fat mass. The same machine assesses bone density in osteoporosis (brittle bones) patients. It is accurate, reliable, and convenient.
Fat percentage: The cut-off for healthy body fat percentage is less than 25% in men and 35% in women. However, the optimal fat percentage for adult men is 12% to 20% and 20% to 30% for ladies.
High blood pressure
High blood pressure increases the risk of acute metabolic complications such as heart attack or stroke. The availability of digital electronic BP devices has made it possible for everyone to monitor their blood pressure at home, aiming to detect and correct BP early.
A reading of <120/80 is optimal, <130/85 is normal, a BP <140.90 is pre-hypertension, >140/90 is grade 1 hypertension, a BP >160/100 is grade 2 hypertension, and a BP >180/110 is grade 3 hypertension.
Blood sugar
You can monitor your blood sugar at home using Continuous Glucose Monitoring (CGM): you buy a blood sugar sensor and download the app to your mobile phone. This will allow you see the impact of different food items and other lifestyles on your blood sugar levels. Helping you to make better food choices and adjust your lifestyle.
Your blood sugar returns to normal within 2 hours of eating sugar and carbs but 3 to 5 hours after eating fat. Hence, testing blood fat levels after a meal will tell you whether your blood sugar is raised because of poor sugar or fat processing. This will help address the real problem rather than experimenting randomly.
Ask your doctor
Ask your doctor to request the metabolic panel. This includes tests to check inflammation markers (hs-CRP), spot blood sugar and cumulative (HbA1C) blood sugar, blood lipid (fat) profile, uric acid level, and liver function to check for fatty liver. These are based on blood samples taken after 8 to 12 hours of overnight fasting.
We must avoid sugar spikes after meals, as these can damage body systems such as the eye and kidney or cause nerve damage. Please note that blood sugar stays within the normal range despite increasing insulin resistance (IR) because the pancreas releases more insulin to compensate for the loss of insulin receptor sensitivity.
The Glucose Tolerance Test (GTT) monitors glucose levels after having 75g of sugar. This should stay below 7.8 mmol/L (140 mg/dl) two hours after the sugar meal. However, fasting insulin, the gold standard test of IR, becomes elevated earlier. Other surrogate markers of IR, including HOMA-IR (available in a few labs), triglyceride (TG), high-density lipoprotein (HDL) and TG/HDL, can also indirectly detect the problem; the latter tests are available everywhere.
Healthy people in the UK have fasting blood sugar levels between 4.0 mmol/L (72 mg/dl) and 5.4 mmol/L (97 mg/dl). Studies have confirmed that a level below 4.7 mmol/L (85 mg/dl) is associated with a low disease risk. The disease risk starts to escalate gradually from 4.7 mmol/L.
A fasting blood sugar level between 6.0 mmol/L (108 mg/dl) and 6.9 mmol/L (124 mg/dl) reaches a prediabetic level. Like diabetes itself, this increases your risk of diabetic complications such as heart attack and stroke. A level of 7.0 mmol/L (126 mg/dl) and above is diagnostic of diabetes.
A ‘snap’ blood sugar test is helpful, but a cumulative one (HbA1C) is more sensitive and reflects blood sugar control over the last three months. A haemoglobin A1C reading of less than 5.5 is normal, 5.5 to 6.4 is prediabetic, and 6.5 and above is diagnostic of diabetes.
Triglycerides (TG)
A high blood TG (standard fat) level is the forgotten risk factor for vascular disease. It indicates liver insulin resistance and the onset of non-alcoholic fatty liver. It is primarily raised due to the high consumption of corn sugar intake (HFCS) and processed carbs. High TG and low HDL are the earliest signs of metabolic syndrome. TG level should be less than 1.7 mmol/L 150 mg/dl.
 Total cholesterol, LDL and HDL
We thought that LDL (the bad guy) was responsible for heart attacks. However, a large meta-analysis of patients admitted with a heart attack revealed that none had high cholesterol, 75% had normal LDL (bad) cholesterol, and 50% had optimal LDL cholesterol. This raised doubts about the validity of total cholesterol and LDL to predict the risk of a heart attack. The normal range for total cholesterol is less than 5 and LDL less than 3.
Another study found that 90% of patients who suffered a heart attack had a low HDL. This makes a low level of the protector HDL the real driver of heart attacks.
The total cholesterol and HDL ratio is a better tool to assess the risk of a heart attack. The normal range for HDL is >1.0 mmol/L (>40 mg/dl). Ensure your HDL (the protector) is over 1.0. Exercise and healthy fat can raise your HDL.
So, my friends, you can see how crucial it is to detect your metabolic risk as early as possible. This minimises the likelihood of suffering a medical disaster like a heart attack and maximises your opportunity to enjoy lifelong health. Caught early, the metabolic risk factors are comparatively straightforward to resolve. If you are worried about your health in this respect, I would be only too happy to guide you through the relevant tests. Please share your thoughts and questions by commenting on this piece, and please subscribe to the newsletter so you don’t miss further vital information. Thank you!
References
Body roundness index is a superior indicator to associate with cardio‐metabolic risk: evidence from a cross‐sectional study with 17,000 Eastern China adults
Jinjian Xu, Liqun Zhang, Qiong Wu, Yaohan Zhou, Ziqi Jin, Zhijian Li & Yimin Zhu
BMC Cardiovascular Disorders volume 21, Article number: 97 (2021)
Screening tools for metabolic syndrome based on anthropometric cut-off values among Thai working adults: a community-based study
https://pubmed.ncbi.nlm.nih.gov/37805820/
Most heart attack patients’ cholesterol levels did not indicate cardiac risk